
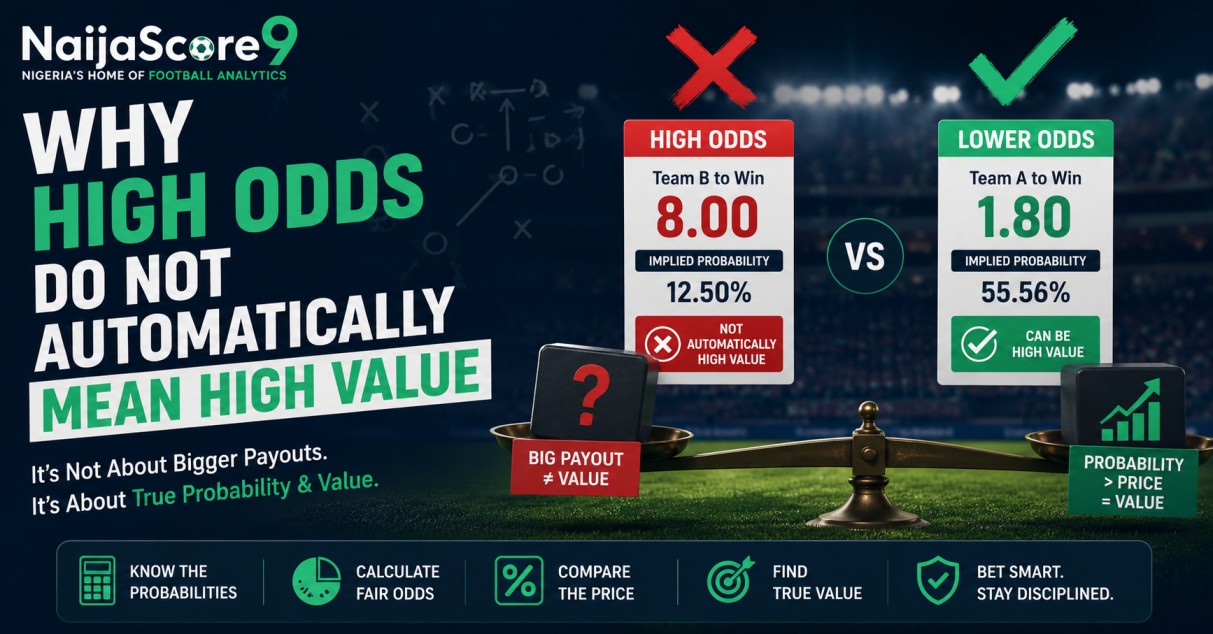
Odds of 8.00 on a football team can look more attractive than odds of 1.60. The first price offers a much larger potential payout, while the second appears to provide relatively little profit for the amount risked.
That comparison can create a serious misunderstanding:
A large potential return is not the same as good betting value.
High odds usually indicate that an outcome is considered less likely to happen. The potential return is larger because the probability of success is lower—not because the selection is automatically underpriced.
A football selection at odds of 8.00 can represent poor value if its realistic probability of winning is only 8%. At the same time, a selection priced at 1.80 can represent positive value if its actual probability is closer to 60%.
The correct question is therefore not:
“How much can this selection pay?”
It is:
“Are the available odds higher than the fair odds justified by the outcome’s probability?”
Understanding that distinction is fundamental to analysing football prices responsibly.
What Do High Odds Mean in Football Betting?
High odds represent a relatively large potential return and a relatively low implied probability.
With decimal odds, the total potential return is calculated by multiplying the stake by the available price:
Potential return = stake × decimal odds
A ₦1,000 stake at odds of 6.00 would produce a total return of ₦6,000 if successful. That amount consists of:
- the original ₦1,000 stake;
- ₦5,000 in profit.
However, the price also represents a probability.
The raw implied probability of decimal odds is calculated as:
Implied probability = 1 ÷ decimal odds
Odds of 6.00 therefore imply:
1 ÷ 6.00 = 0.1667
Expressed as a percentage:
16.67%
You can use the NaijaScore9 implied probability calculator to convert any decimal price into its raw break-even probability.
Where prices are displayed in another format, use our tool to convert betting odds between decimal, fractional and American formats.
The price is not saying that the outcome offers six times the value. It is indicating that the outcome has been priced as relatively unlikely.
What Is Betting Value?
Betting value describes the relationship between:
- the probability represented by the available odds; and
- your defensible estimate of the outcome’s actual probability.
A selection may have positive value when your estimated probability is higher than the break-even probability represented by the price.
For example:
- available decimal odds: 3.00;
- implied probability: 33.33%;
- your estimated probability: 38%.
The available odds require the selection to win approximately one out of every three equivalent attempts to break even before costs. Your analysis estimates that the outcome should occur more frequently.
Under those assumptions, the price may represent positive expected value.
However, that conclusion is only as reliable as the 38% probability estimate. Confidence alone is insufficient. The estimate should be supported by relevant information, a consistent process and realistic acknowledgement of uncertainty.
Follow a documented football prediction methodology when building probabilities from team strength, form, line-ups, injuries, match context and market information.
Value is not a permanent quality of a team or selection.
A club is not simply “a value team.” A correct-score outcome is not permanently “good value.” Value exists at a particular price relative to a particular probability estimate.
High Odds, High Payout and High Value Are Different
These terms should not be used interchangeably.
| Term | Meaning |
| High odds | A large numerical price representing a relatively low implied probability |
| High payout | A large potential return compared with the amount staked |
| High value | A price that exceeds the fair odds supported by a defensible probability estimate |
| High probability | An outcome considered relatively likely to occur |
| High confidence | A subjective feeling that may or may not be supported by evidence |
A selection can have:
- high odds but negative value;
- low odds but positive value;
- high odds and positive value;
- low odds and negative value.
The size of the price does not answer the value question.
Example of High Odds With Negative Value
Suppose a football team is available to win at decimal odds of 6.00.
The raw implied probability is:
1 ÷ 6.00 = 16.67%
After analysing the expected line-up, injuries, opponent strength, tactical match-up and recent underlying performance, you estimate that the team’s actual probability of winning is only 12%.
The price appears attractive because a ₦10,000 stake could produce a ₦60,000 total return. But the payout does not sufficiently compensate for the estimated probability.
The expected-return calculation is:
Expected return per unit staked = estimated probability × decimal odds
Using the example:
0.12 × 6.00 = 0.72
The expected return is ₦0.72 for every ₦1 stake.
The estimated expected value is:
0.72 − 1 = −0.28
That equals an estimated expected value of −28%.
The selection could still win. A negative-value assessment does not mean that the outcome must be lost. It means the available price does not adequately compensate for the estimated probability across repeated equivalent situations.
Example of Lower Odds With Positive Value
Now consider a team available at odds of 1.80.
The implied probability is:
1 ÷ 1.80 = 55.56%
Your independent analysis estimates that the team has a 60% chance of winning.
The expected return per unit staked is:
0.60 × 1.80 = 1.08
The estimated expected value is:
1.08 − 1 = +0.08
That is an estimated positive expected value of 8%.
A ₦10,000 stake would still lose completely if the selection failed. Positive value does not make one outcome safe. It means the price may be favourable relative to the estimated probability over a meaningful number of comparable decisions.
The Break-Even Probability Matters More Than the Payout
Every decimal price has a break-even probability.
| Decimal odds | Raw implied probability |
| 1.50 | 66.67% |
| 1.80 | 55.56% |
| 2.00 | 50.00% |
| 3.00 | 33.33% |
| 5.00 | 20.00% |
| 8.00 | 12.50% |
| 10.00 | 10.00% |
Odds of 10.00 do not automatically offer more value than odds of 2.00.
The 10.00 selection must have a realistic probability above approximately 10% to indicate positive value before costs. The 2.00 selection must have a realistic probability above approximately 50%.
The analytical task is to determine which estimate, if either, is defensible.
Fair Odds Explain the Real Value Question
Fair odds are the decimal price corresponding to your estimated probability before a bookmaker margin is applied.
The calculation is:
Fair odds = 1 ÷ estimated probability
Suppose you estimate that a team has a 25% probability of winning.
Its estimated fair odds are:
1 ÷ 0.25 = 4.00
Different available prices can then be compared with that estimate:
| Available odds | Estimated fair odds | Initial assessment |
| 3.40 | 4.00 | Below estimated fair value |
| 3.80 | 4.00 | Still below estimated fair value |
| 4.00 | 4.00 | Approximately break-even |
| 4.30 | 4.00 | Potential positive value |
| 4.75 | 4.00 | Larger theoretical edge if the estimate is accurate |
Odds of 4.75 may be valuable when fair odds are estimated at 4.00.
The same 4.75 price would be a poor value if the outcome’s realistic probability were only 15%, corresponding to fair odds of approximately 6.67.
Bookmaker Odds Include a Margin
The implied probabilities of all outcomes in a bookmaker market usually total more than 100%.
The amount above 100% is commonly called the:
- bookmaker margin;
- overround;
- vig;
- juice.
Suppose a football 1X2 market contains these prices:
| Outcome | Decimal odds | Raw implied probability |
| Home win | 1.70 | 58.82% |
| Draw | 4.00 | 25.00% |
| Away win | 5.50 | 18.18% |
| Total | — | 102.00% |
The raw probabilities total 102%, not 100%.
The additional 2% represents the market overround in this simplified example. Raw implied probability should therefore not automatically be treated as a clean estimate of the bookmaker’s underlying assessment.
Use the NaijaScore9 calculator to remove the bookmaker margin from a complete two-way or three-way market.
Raw Implied Probability Is Not Necessarily True Probability
Odds provide a market price, not a guaranteed statement of objective truth.
A price may reflect:
- statistical models;
- team news;
- expected starting line-ups;
- customer activity;
- market liquidity;
- liability management;
- competitor prices;
- built-in margin.
The implied probability is the probability represented by the price. It is not automatically the true probability of the outcome.
Your own estimate should also be treated cautiously. A personal model can miss relevant information, place too much weight on recent results or underestimate uncertainty.
The purpose of analysis is not to assume that the market is wrong. It is to determine whether the available price differs meaningfully from a well-supported probability estimate.
Why High Odds Attract Bettors?
The Potential Return Is Easy to Visualise
A ₦2,000 stake at odds of 12.00 offers a potential return of ₦24,000.
That figure is emotionally powerful. The less visible part of the calculation is the high probability of losing the full ₦2,000.
Large payouts can dominate attention while the low success rate receives insufficient consideration.
Small Stakes Can Display Large Returns
High-odds accumulators and correct-score selections allow a relatively small stake to show a large possible payout.
This can make the risk appear insignificant even when the combined probability is extremely low.
The correct question is not only:
“How little am I staking?”
It is also:
“Does the potential return adequately compensate for the actual chance of winning?”
Longshot Wins Are Memorable
A selection that wins at odds of 20.00 is likely to be remembered and discussed. Numerous losing high-odds selections may receive much less attention.
This can create an incomplete personal record in which dramatic wins are remembered while routine losses are forgotten.
High Odds Can Be Mistaken for a Bookmaker Error
A user may assume that an unfamiliar team priced at 9.00 has been overlooked.
Sometimes prices can be inaccurate. However, an unexpected price is not proof of mispricing. The market may be accounting for injuries, line-up expectations, travel, tactical disadvantages or other information the user has not considered.
The Underdog Story Is Persuasive
Football regularly produces upsets. A red card, penalty, goalkeeper mistake or exceptional individual performance can change a match.
However, the fact that an outcome is possible does not mean it is probable enough at the offered odds.
“Anything can happen” is not a probability estimate.
High Odds Can Still Represent Genuine Value
High odds are not automatically bad.
A large price can offer value when the outcome’s realistic probability is higher than the probability represented by the odds.
Suppose:
- available odds: 8.00;
- implied probability: 12.50%;
- estimated probability: 16%.
The expected return per unit staked is:
0.16 × 8.00 = 1.28
The estimated expected value is:
1.28 − 1 = +0.28
That represents a theoretical expected value of +28%.
The price may be attractive—but only if the 16% estimate is credible.
If the true probability were 10%, the same price would produce:
0.10 × 8.00 = 0.80
Estimated expected value:
0.80 − 1 = −0.20
That equals an estimated expected value of −20%.
The price has not changed. Only the probability assessment has changed.
That is why value is a relationship between price and probability.
How to Evaluate a High-Odds Football Selection?
Define the Exact Market
Identify precisely what must occur for the selection to win.
Examples include:
- away team to win after 90 minutes;
- away team to qualify;
- correct score;
- first goalscorer;
- Over 2.5 Goals;
- team to win either half;
- player to score at any time.
Similar-looking markets can have different settlement conditions.
An away team priced at 5.00 to win in 90 minutes is not directly comparable with the same team priced at 2.75 to qualify after extra time or penalties.
Convert the Price Into Implied Probability
Use:
Implied probability = 1 ÷ decimal odds
For odds of 7.50:
1 ÷ 7.50 = 13.33%
This provides the raw break-even reference represented by the displayed price.
Examine the Complete Market
Do not assess one price in isolation when the full market is available.
For a football match-result market, record the:
- home-win odds;
- draw odds;
- away-win odds.
Calculate the complete implied total and remove the margin where appropriate. This provides a cleaner picture of how the market is priced.
Build an Independent Probability Estimate
Your estimate should consider information relevant to the exact market.
For a football match-result selection, that may include:
- underlying attacking and defensive performance;
- opponent strength;
- home and away records;
- expected line-ups;
- injuries and suspensions;
- fixture congestion;
- rest and travel;
- expected-goals data;
- tactical match-ups;
- set-piece strength;
- goalkeeper performance;
- competition priority.
Recovery time and rotation should be evaluated carefully because fixture congestion affects match probabilities differently depending on squad depth, individual minutes and travel demands.
Avoid counting the same evidence more than once. Recent results, goals scored and expected-goals numbers may describe overlapping aspects of performance.
Create a Probability Range
A single number can imply more precision than the available information supports.
Instead of stating:
“The away team has exactly a 17% probability.”
A more realistic assessment may be:
- conservative estimate: 13%;
- central estimate: 16%;
- optimistic estimate: 19%.
At odds of 6.50, the implied probability is approximately 15.38%.
The selection appears:
- negative value under the conservative estimate;
- marginally positive under the central estimate;
- more attractive under the optimistic estimate.
This reveals how strongly the conclusion depends on uncertain assumptions.
Test the Estimate Against Team-News Scenarios
High-odds selections can be extremely sensitive to line-ups.
| Scenario | Estimated away-win probability |
| Strongest expected line-up | 18% |
| Main striker absent | 14% |
| Striker and first-choice centre-back absent | 11% |
| Opponent rotates heavily | 21% |
If the available price implies 15%, the value assessment changes substantially across those scenarios.
Waiting for confirmed line-ups can improve the estimate, although the odds may move before the team news becomes official.
Compare Prices Across Betting Sites
Suppose your fair probability estimate is 20%, corresponding to fair odds of 5.00.
| Available price | Assessment |
| 4.50 | Negative value |
| 4.80 | Negative value |
| 5.00 | Approximately fair |
| 5.20 | Slight potential value |
| 5.75 | More favourable if conditions match |
The selection has not changed, but the value has.
Before accepting a price, compare football odds for the same event, market, line and settlement conditions.
You can also review operator information across selected betting sites in Nigeria, while checking eligibility, current odds and terms directly with each operator.
Account for Commission, Tax and Deductions
The headline odds may not equal the effective final price.
Consider:
- exchange commission;
- applicable taxes;
- payment charges;
- currency-conversion costs;
- stake deductions;
- dead-heat rules;
- maximum-payout restrictions.
A small theoretical edge can disappear once costs are included.
Compare With the Closing Price
The closing price is the market price available shortly before an event begins.
Consistently taking a higher price than the eventual closing price can suggest that the initial selection obtained a favourable number.
For example:
- price taken: 4.50;
- closing price: 3.90.
The earlier price was materially higher.
By contrast:
- price taken: 4.50;
- closing price: 5.20.
The market later moved against the original assessment.
This comparison should be evaluated across many selections rather than one match.
Why Bookmakers Offer Different Odds?
Different bookmakers can publish different prices for the same football outcome because they may use different:
- probability models;
- margins;
- customer demand;
- risk limits;
- liability positions;
- market-update speeds.
A bookmaker with heavy exposure on one outcome may shorten that price, while another operator may continue offering a higher number.
Read why bookmakers offer different odds for a fuller explanation of how price formation and market movement work.
Different prices do not prove that one operator has made an obvious mistake. The full market and settlement conditions must still be compared.
High Odds and Variance
High-odds selections naturally produce lower win rates.
A theoretically valuable selection at 6.00 can lose several times consecutively. That does not automatically prove that the original estimate was wrong.
Equally, one dramatic win does not prove that the strategy was profitable.
Consider selections with a genuine 20% probability of winning. Even when the estimate is accurate, approximately four out of every five attempts are expected to lose over a sufficiently large sample.
Results will not arrive in a perfect pattern of one win after every four losses. Losing outcomes can cluster.
This creates two analytical risks:
- abandoning a sound process after a short losing period;
- defending a poor process indefinitely by claiming every loss is variance.
Maintain records of:
- price taken;
- closing price;
- estimated probability;
- fair odds;
- stake;
- result;
- expected value;
- market type;
- reasoning recorded before kick-off.
High Odds in Accumulators
Accumulator odds become large because the combined probability falls as more selections are added.
Suppose five selections each have an estimated 60% probability of winning.
The probability that all five win is:
0.60 × 0.60 × 0.60 × 0.60 × 0.60 = 7.78%
Each selection may individually be more likely to win than lose, but the complete five-selection accumulator has less than an 8% success probability under those assumptions.
In real accumulators, selections may be correlated, while bookmaker margins are also included in each price.
Combining several negative-value selections does not turn them into one positive-value bet. It can compound the disadvantage.
High Odds in Correct-Score Markets
Correct-score markets contain many possible outcomes.
A score such as 2–1 may appear realistic, but so may:
- 1–0;
- 1–1;
- 2–0;
- 2–2;
- 3–1;
- 0–1;
- another result.
Each exact score occupies only one part of the full probability distribution.
Odds of 9.00 on 2–1 imply approximately 11.11% before adjusting for the market margin.
The relevant question is not whether 2–1 looks plausible. It is whether that exact score should occur more frequently than the probability represented by the price.
Plausibility is not the same as probability.
High Odds in First-Goalscorer Markets
First-goalscorer prices depend on several connected probabilities:
- the player starts;
- the player remains on the pitch long enough;
- the match contains at least one goal;
- the player’s team scores first;
- the player scores that goal;
- another teammate does not score first.
A striker priced at 8.00 may appear attractive based on recent goals. However, the assessment must also account for expected minutes, penalties, set pieces, substitution patterns and the possibility of a goalless match.
Player markets require player-level probabilities, not only general team attacking form.
Why Win Rate Alone Does Not Measure Value?
A bettor who wins 70% of selections is not automatically profitable.
Suppose every winning selection is taken at odds of 1.30.
Across ten equal ₦1,000 selections with seven wins and three losses:
- profit from seven winners: ₦2,100;
- loss from three losers: ₦3,000;
- net result: −₦900.
The strike rate is 70%, but the overall result is negative.
Now suppose another bettor wins only 30% of selections at average odds of 4.00.
Across ten equal ₦1,000 selections:
- return from three winners: ₦12,000;
- total amount staked: ₦10,000;
- net result: +₦2,000.
The second bettor loses more often but receives prices that compensate for the lower strike rate in this example.
Our guide to prediction accuracy, strike rate and ROI explains why winning percentage alone cannot measure forecasting or betting performance.
Profitability depends on the relationship between price and probability—not win percentage alone.
Common Mistakes When Assessing High Odds
Judging Value by Potential Winnings
The amount displayed on a bet slip does not show whether the price is fair.
Treating an Upset as Proof of Value
An underdog winning does not prove that its earlier odds were valuable. Poor-value selections can win.
Treating a Loss as Proof of No Value
A positive-value selection can lose. One result cannot validate or invalidate a probability estimate.
Even a strong probability can fail in one match, as explained in why a 70% football prediction can still lose.
Using Confidence Instead of Probability
Statements such as “I strongly believe they will win” are not measurable.
Convert the belief into a probability and compare it with the available price.
Ignoring the Bookmaker Margin
Raw implied probabilities contain the pricing margin. Examine the complete market whenever possible.
Using One Bookmaker’s Price
A selection may be poor value at one site and potentially favourable at another.
Overestimating Underdogs Because of Recent Results
A surprise win against a strong team can dominate attention even when the underlying performance was not repeatable.
Review:
- chances created;
- chances conceded;
- red cards;
- penalties;
- finishing variance;
- expected line-ups.
Chasing Losses With Longer Odds
Moving from ordinary selections to extreme longshots after losing does not recover value. It usually increases variance and the probability of another complete loss.
Increasing the Probability to Justify the Bet
The probability estimate should determine whether the price is acceptable.
It should not be increased emotionally because the potential payout appears attractive.
High Odds vs Good Odds
“High odds” and “good odds” describe different things.
High odds means that the numerical price is large.
Good odds means that the available price compares favourably with a defensible estimate of fair value.
Odds of 10.00 can be poor when fair odds are 15.00.
Odds of 1.70 can be good when fair odds are 1.50.
The numerical size of the price is secondary. The comparison is what matters.
Can a Favourite Offer More Value Than an Underdog?
Yes.
Suppose the market offers:
- favourite: 1.80;
- underdog: 5.50.
Your probability estimates are:
- favourite: 61%;
- underdog: 15%.
For the favourite:
0.61 × 1.80 = 1.098
Estimated expected value: +9.8%
For the underdog:
0.15 × 5.50 = 0.825
Estimated expected value: −17.5%
The underdog offers the larger potential payout. The favourite offers the stronger estimated value.
This does not guarantee that the favourite will win. It means the favourite’s price is more favourable relative to the stated probability estimates.
Can Every Outcome in a Market Be Poor Value?
Yes.
A bookmaker can price all available outcomes with a margin, meaning none of the displayed prices offers sufficient compensation according to your estimated fair probability distribution.
The most accurate conclusion may be:
- the favourite is priced too short;
- the draw is priced too short;
- the underdog is also priced too short;
- no available outcome offers sufficient value.
Choosing not to make a selection is a valid analytical decision.
How Much Edge Is Enough?
A tiny estimated advantage may not be meaningful when probability uncertainty is large.
Suppose:
- available odds: 3.40;
- implied probability: 29.41%;
- estimated probability: 30%.
The theoretical advantage is very small.
If the realistic probability range is 26% to 33%, the conclusion is highly sensitive to model error. Costs, team news or one inaccurate assumption can remove the apparent edge.
A larger difference between estimated fair odds and available odds provides more protection against uncertainty, but no fixed threshold guarantees profitability.
Using the NaijaScore9 Kelly Criterion Calculator
After building an independent probability estimate, you can use the NaijaScore9 tool to calculate a theoretical Kelly stake from your:
- decimal odds;
- estimated win probability;
- betting bankroll;
- selected Kelly fraction.
The calculator does not determine whether your probability is accurate. It only converts the values you enter into a theoretical bankroll allocation.
An inaccurate or overconfident probability estimate can produce an excessively large calculated stake.
Final Assessment
High odds tell you that a football outcome offers a large potential return and has been priced as relatively unlikely.
They do not tell you whether the outcome is underpriced.
To assess value correctly:
- convert the odds into implied probability;
- examine the complete market and bookmaker margin;
- produce an independent probability estimate;
- convert that estimate into fair odds;
- compare the fair odds with the available price;
- account for uncertainty, costs and settlement rules;
- record the reasoning before the outcome is known.
A selection at odds of 8.00 may be valuable, fairly priced or significantly overpriced. The size of the price cannot distinguish between those possibilities.
The central principle is simple:
High odds describe the payout. Value describes whether that payout adequately compensates for the probability of losing.