
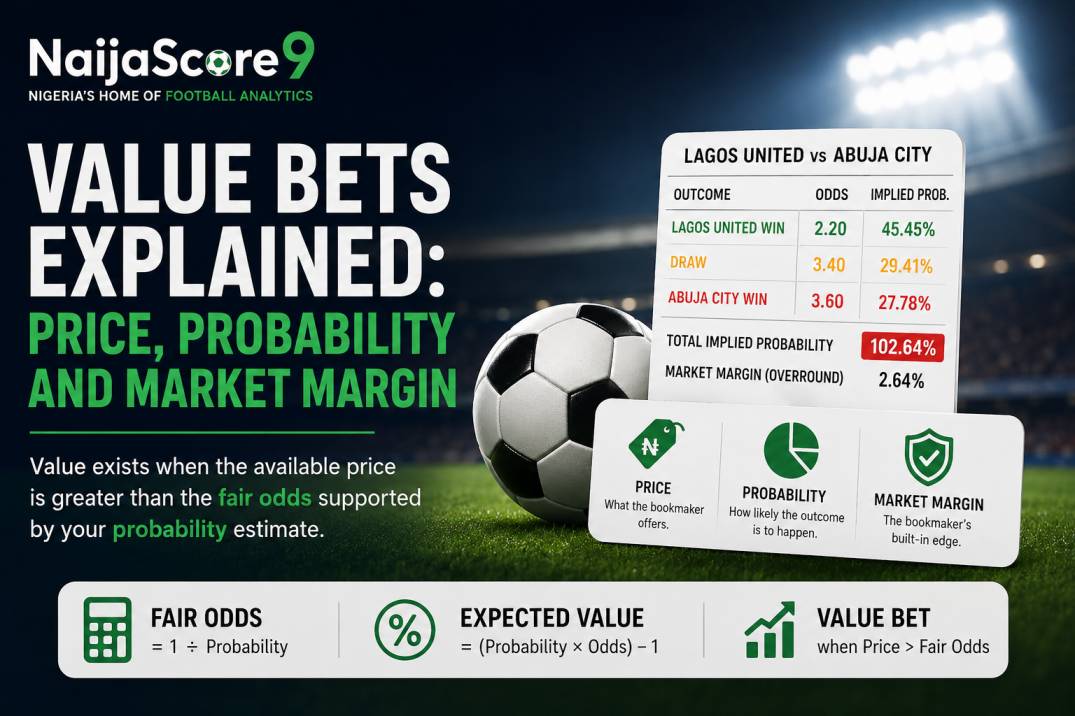
A team can be highly likely to win and still offer poor value. Another team can be unlikely to win but offer a potentially favourable price.
This is because probability and value are not the same thing.
Probability asks:
How likely is the outcome to happen?
Value asks:
Does the available price adequately compensate for that probability?
Suppose a football team has a realistic 60% chance of winning. Its estimated fair decimal odds would be approximately 1.67.
If a bookmaker offers 1.80, the price may be favourable under that estimate. If the bookmaker offers only 1.50, the same team may be likely to win but poorly priced.
The team’s underlying probability has not changed. The available price has.
A value bet therefore depends on three connected elements:
- Price: the odds available for the selection.
- Probability: a defensible estimate of how often the outcome should occur.
- Market margin: the bookmaker’s pricing margin built across the complete market.
Understanding these elements is more useful than asking whether a selection looks “safe,” whether its odds are high or whether many people are backing it.
A value assessment does not guarantee a winning result. It is an estimate of whether the potential return is sufficient for the risk represented by the probability.
What Is a Value Bet?
A value bet is a selection where the available odds appear higher than the fair odds justified by an independent probability estimate.
For example:
- available odds: 2.20;
- break-even probability: 45.45%;
- your estimated probability: 50%;
- your estimated fair odds: 2.00.
Under those assumptions, odds of 2.20 are greater than your estimated fair price of 2.00.
That difference may indicate positive expected value.
However, the conclusion depends completely on the quality of the 50% estimate. If the true probability is only 42%, the same odds of 2.20 would represent negative value.
A selection is not valuable simply because:
- the team is expected to win;
- the odds are unusually high;
- the potential payout is large;
- the team has won several recent matches;
- the price has shortened;
- a tipster describes it as certain;
- many users have added it to their bet slips.
Value exists only when the price-probability relationship is favourable.
The Three Parts of a Value Bet
1. Price
The price is the odds available for the selected outcome.
With decimal odds, the total potential return is calculated as:
Total return = stake × decimal odds
If a Nigerian user stakes ₦5,000 at odds of 2.20:
₦5,000 × 2.20 = ₦11,000
That amount includes:
- the original ₦5,000 stake;
- ₦6,000 potential profit.
The price also represents a raw break-even probability.
At odds of 2.20:
1 ÷ 2.20 = 45.45%
The selection would need to win more frequently than approximately 45.45% over comparable opportunities to produce a positive theoretical return before taxes, commission, deductions or estimation error.
You can use the NaijaScore9 implied probability calculator to convert a decimal price into its raw break-even percentage.
When odds are displayed in fractional or American format, use the odds converter before comparing prices.
2. Probability
Probability is an estimate of how likely the selected event is to occur.
For a football match-result market, a probability model may consider:
- underlying team strength;
- home advantage;
- opponent quality;
- expected starting line-ups;
- injuries and suspensions;
- recent attacking and defensive performance;
- expected goals;
- tactical match-ups;
- rest and travel;
- fixture congestion;
- competition priority;
- goalkeeper quality;
- set-piece performance;
- uncertainty around team news.
A probability should be expressed as a number rather than a feeling.
Instead of saying:
“I strongly believe the home team will win.”
A structured assessment might say:
“The estimated home-win probability is between 48% and 53%, with a central estimate of 51%.”
That estimate can then be compared with the bookmaker’s price.
The NaijaScore9 football prediction methodology provides a structured framework for evaluating match information without treating one statistic or recent result as conclusive.
3. Market Margin
A bookmaker normally does not price every outcome at fair odds.
The raw implied probabilities across the complete market usually add up to more than 100%. The amount above 100% is commonly described as the:
- bookmaker margin;
- overround;
- vig;
- juice.
For a football 1X2 market, the home win, draw and away win are intended to cover all possible full-time results.
Suppose the prices are:
| Outcome | Decimal odds | Raw implied probability |
| Home win | 2.20 | 45.45% |
| Draw | 3.40 | 29.41% |
| Away win | 3.60 | 27.78% |
| Market total | — | 102.64% |
A fair three-way probability distribution should total 100%.
This market totals 102.64%, creating a proportional overround of approximately 2.64 percentage points.
The raw implied probabilities therefore cannot all represent fair probabilities simultaneously. Betting-margin calculations use the full set of outcomes rather than one price in isolation.
Use the NaijaScore9 tool to remove the bookmaker margin from a complete two-way or three-way market.
Price Is Not the Same as Probability
Odds and probability are closely connected, but they should not be treated as identical.
The displayed price represents:
- the bookmaker’s assessment;
- a built-in margin;
- market information;
- customer activity;
- liability management;
- competing market prices;
- current team news.
It does not provide an objective guarantee of the true probability.
Similarly, your own probability is not automatically more accurate because it is independent.
A personal estimate can be wrong because it:
- overweights recent results;
- underestimates the opponent;
- uses incomplete line-up information;
- counts the same evidence more than once;
- ignores tactical context;
- mistakes confidence for probability;
- fails to account for uncertainty.
Football-odds research generally finds that bookmaker markets contain substantial forecasting information, although studies report different degrees of efficiency across leagues, periods and market structures. That means the market is informative but not necessarily perfect.
The purpose of value analysis is not to assume that every bookmaker is wrong. It is to determine whether a defensible estimate differs sufficiently from the available price.
How to Convert Odds Into Implied Probability?
For decimal odds:
Implied probability = 1 ÷ decimal odds
To express the result as a percentage:
Implied probability percentage = 1 ÷ decimal odds × 100
Examples:
| Decimal odds | Raw implied probability |
| 1.50 | 66.67% |
| 1.67 | 59.88% |
| 1.80 | 55.56% |
| 2.00 | 50.00% |
| 2.20 | 45.45% |
| 2.50 | 40.00% |
| 3.00 | 33.33% |
| 4.00 | 25.00% |
| 5.00 | 20.00% |
| 10.00 | 10.00% |
This percentage is a break-even reference before properly removing the complete market margin.
The calculation itself is straightforward, but interpretation requires caution. A price of 2.00 represents a raw implied probability of 50%, yet the bookmaker may have priced the complete market above 100%.
How to Calculate Fair Odds?
Fair odds are the decimal price corresponding to an estimated probability without an added bookmaker margin.
The formula is:
Fair odds = 1 ÷ estimated probability
Suppose your estimated probability is 55%.
Convert 55% into decimal form:
55% = 0.55
Then calculate:
1 ÷ 0.55 = 1.82
Your estimated fair odds are approximately 1.82.
Compare that with different available prices:
| Available odds | Estimated fair odds | Assessment |
| 1.65 | 1.82 | Below estimated fair price |
| 1.75 | 1.82 | Still below fair price |
| 1.82 | 1.82 | Approximately fair before uncertainty |
| 1.90 | 1.82 | Potential positive value |
| 2.00 | 1.82 | Greater theoretical edge if the estimate is accurate |
The outcome may be exactly the same in every row. Only the price changes.
That is why a selection can move from unattractive to potentially valuable without any change in the expected result.
A Complete Football Value-Bet Example
Consider a fictional match:
Lagos United vs Abuja City
The available 1X2 prices are:
| Outcome | Offered odds |
| Lagos United win | 2.20 |
| Draw | 3.40 |
| Abuja City win | 3.60 |
Step 1: Calculate Raw Implied Probabilities
For Lagos United:
1 ÷ 2.20 = 45.45%
For the draw:
1 ÷ 3.40 = 29.41%
For Abuja City:
1 ÷ 3.60 = 27.78%
The total is:
45.45% + 29.41% + 27.78% = 102.64%
Step 2: Estimate the Market Margin
The raw market is 2.64 percentage points above 100%.
The proportional overround is therefore approximately:
102.64% − 100% = 2.64%
This does not mean the bookmaker will earn exactly 2.64% from the match. Overround describes the mathematical pricing margin. Realised revenue depends on stakes, customer selections, liabilities, payouts and other operational factors.
Step 3: Remove the Margin Proportionally
Divide each raw implied probability by the market total.
For Lagos United:
45.45 ÷ 102.64 = 44.28%
For the draw:
29.41 ÷ 102.64 = 28.65%
For Abuja City:
27.78 ÷ 102.64 = 27.07%
The proportional no-vig market is approximately:
| Outcome | Raw implied probability | Estimated no-vig probability |
| Lagos United | 45.45% | 44.28% |
| Draw | 29.41% | 28.65% |
| Abuja City | 27.78% | 27.07% |
| Total | 102.64% | 100.00% |
These no-vig probabilities estimate how the selected market might look after the overround is removed proportionally.
They are not automatically the true probabilities.
Step 4: Build an Independent Estimate
Suppose your analysis produces:
| Outcome | Your estimated probability |
| Lagos United | 48% |
| Draw | 28% |
| Abuja City | 24% |
| Total | 100% |
Your assessment gives Lagos United a higher probability than both:
- the raw break-even probability of 45.45%;
- the proportional market estimate of 44.28%.
Step 5: Calculate Your Fair Odds
For Lagos United:
1 ÷ 0.48 = 2.08
Your estimated fair price is approximately 2.08.
The bookmaker offers 2.20.
Under your assumptions, the available price is higher than your estimated fair odds.
Step 6: Calculate Expected Value
For decimal odds, a compact expected-value calculation is:
Expected value = estimated probability × decimal odds − 1
For Lagos United:
0.48 × 2.20 − 1 = 0.056
Expressed as a percentage:
5.6% estimated expected value
For every ₦1,000 staked repeatedly under identical probability and price assumptions, the theoretical average expected profit would be:
₦1,000 × 5.6% = ₦56
That does not mean each ₦1,000 selection will return ₦56 profit.
One attempt produces either the settled winning return or a loss. Expected value describes a theoretical average across repeated comparable decisions. The standard expected-value framework weights each possible financial outcome by its probability.
Expected Value Does Not Predict One Result
A positive-value selection can lose.
A negative-value selection can win.
Suppose a team has a genuine 40% probability of winning and is offered at fair odds above 2.50.
Even with a valid probability estimate, the team is expected not to win approximately 60% of comparable matches.
One loss therefore cannot prove that the original value assessment was incorrect.
Likewise, one winning selection at poor odds does not prove that the price was valuable.
Value is assessed from the information and odds available before the match, not from the result afterwards.
This distinction is examined further in why a 70% football prediction can still lose.
Value Bet vs Winning Bet
These terms describe different concepts.
| Value bet | Winning bet |
| Assessed before the match | Known after the match |
| Based on price and estimated probability | Based on the settled outcome |
| Can lose | Has already won |
| May have positive expected value | May have had positive or negative value |
| Requires a probability estimate | Requires only the final result |
A winning selection may have been poorly priced.
A losing selection may have offered a favourable price.
The result does not retrospectively change the original odds or the information available when the decision was made.
Value Bet vs Safe Bet
There is no risk-free football selection simply because its odds are short.
A team priced at 1.20 has a raw implied probability of:
1 ÷ 1.20 = 83.33%
That still leaves a meaningful probability that the selection will not win.
The price may also offer negative value when your estimate is below 83.33%.
For example:
- available odds: 1.20;
- implied probability: 83.33%;
- estimated probability: 78%;
- estimated fair odds: 1.28.
The team may remain very likely to win, but odds of 1.20 would be below the estimated fair price of 1.28.
“Likely to win” and “worth the price” are different conclusions.
Value Bet vs High-Odds Bet
A high-odds selection is not automatically a value bet.
Suppose a team is priced at 8.00.
The raw break-even probability is:
12.50%
If your estimate is 15%, the selection may appear favourable.
If your estimate is 8%, it is negatively priced despite the large payout.
The number 8.00 only describes the offered return and implied probability. It does not indicate whether the price is accurate.
Read why high odds do not automatically mean high value for a more detailed explanation of long prices, payout attraction and probability misjudgement.
Value Bet vs Favourite
A favourite is the outcome with the shortest price in the selected market.
A favourite can offer:
- positive value;
- approximately fair value;
- negative value.
Suppose a favourite is priced at 1.70.
The raw implied probability is:
58.82%
If your estimate is 64%, it may offer potential value.
If your estimate is 55%, the same price would be unattractive.
The favourite label does not determine value.
Value Bet vs Underdog
An underdog is priced as less likely than the favourite.
Underdogs can occasionally offer value, but the higher potential payout should not be mistaken for a favourable price.
Some historical football-market studies have identified favourite-longshot effects, while other samples find little or no consistent bias. The results vary by competition, bookmaker, price source and methodology, so the evidence does not justify treating all favourites or all outsiders as automatically mispriced.
Each outcome still requires an independent price-probability comparison.
Why the Complete Market Matters?
Consider only the home-win odds:
Home win: 2.00
The raw implied probability is 50%.
That appears simple, but the complete market might be:
| Outcome | Market A | Market B |
| Home | 2.00 | 2.00 |
| Draw | 3.60 | 3.20 |
| Away | 4.00 | 3.50 |
Both markets offer the home team at 2.00.
However, their total raw probabilities differ.
Market A
- home: 50.00%;
- draw: 27.78%;
- away: 25.00%;
- total: 102.78%.
Market B
- home: 50.00%;
- draw: 31.25%;
- away: 28.57%;
- total: 109.82%.
The same home price appears inside two differently priced markets.
This is why one outcome’s implied probability should not be treated as a full description of the market.
How Bookmaker Margin Changes the Price?
Suppose a fair two-way market is:
| Outcome | Fair probability | Fair odds |
| Team A | 50% | 2.00 |
| Team B | 50% | 2.00 |
A bookmaker might instead offer:
| Outcome | Offered odds | Raw implied probability |
| Team A | 1.91 | 52.36% |
| Team B | 1.91 | 52.36% |
| Total | — | 104.71% |
The overround is approximately 4.71 percentage points.
The displayed price on each side is lower than the 2.00 fair price.
The margin is therefore reflected through less favourable payouts relative to the assumed fair probabilities.
Lower Margin Does Not Guarantee Value on Every Selection
A market with a lower overround is generally more competitively priced overall.
However, that does not prove that every individual outcome offers a better price.
Consider two operators:
| Outcome | Operator A | Operator B |
| Home | 2.05 | 2.10 |
| Draw | 3.50 | 3.30 |
| Away | 3.80 | 3.70 |
Operator A may have a lower total margin, while Operator B still offers the stronger home-win price.
Users should therefore examine:
- the complete market margin;
- the specific outcome price;
- settlement conditions;
- taxes, commission or deductions;
- stake and payout limits.
The best overall market and the best price for one selection are not always found in the same place.
No-Vig Probability vs Independent Probability
These are related but different measurements.
No-Vig Probability
A no-vig probability is derived from the bookmaker’s complete market after applying a margin-removal method.
It reflects the market’s relative pricing.
Independent Probability
An independent probability comes from your own analysis or forecasting model.
It may use:
- performance data;
- line-ups;
- injuries;
- tactical information;
- historical comparisons;
- market information;
- uncertainty adjustments.
Why They Can Differ?
Suppose:
- no-vig home-win probability: 44%;
- your probability estimate: 48%.
That four-percentage-point difference may represent:
- an analytical edge;
- model error;
- missing information;
- a different interpretation of the evidence;
- an inaccurate market;
- an overconfident personal estimate.
A difference is a reason to investigate further—not proof that the market is wrong.
Different Margin-Removal Methods Can Produce Different Results
The proportional method divides each raw probability by the complete market total.
It is transparent and suitable for quick analysis of conventional two-way and three-way markets.
However, other methods include:
- additive margin removal;
- power methods;
- Shin-based methods;
- odds-ratio methods.
These methods can produce different estimates because bookmaker margin may not be distributed evenly across all outcomes.
Recent forecasting research continues to compare and develop methods for transforming betting odds into calibrated probabilities, indicating that no single basic margin-removal method perfectly represents every bookmaker and market.
The NaijaScore9 No-Vig Calculator uses proportional margin removal and should label its results as estimates rather than true probabilities.
Why Price Comparison Matters?
Suppose your estimated fair odds are 2.00.
Available prices include:
| Betting site | Available odds | Estimated EV |
| Site A | 1.85 | −7.5% |
| Site B | 1.95 | −2.5% |
| Site C | 2.05 | +2.5% |
| Site D | 2.15 | +7.5% |
The probability estimate is 50% in every case.
At Site A:
0.50 × 1.85 − 1 = −7.5%
At Site D:
0.50 × 2.15 − 1 = +7.5%
The match and selection have not changed. The available price determines whether the decision appears favourable under the estimate.
Before accepting a football price, compare football odds for the same market and settlement conditions.
You can also review operator information across relevant betting sites in Nigeria, while confirming current terms, eligibility and accepted prices directly.
Why Football Odds Move After You Identify Value?
Prices do not remain fixed.
Suppose you estimate fair odds of 2.00.
The market initially offers 2.20, which appears favourable.
Later, the price shortens:
2.20 → 2.10 → 1.95
At 2.20, the estimated expected value is:
0.50 × 2.20 − 1 = +10%
At 2.10:
0.50 × 2.10 − 1 = +5%
At 1.95:
0.50 × 1.95 − 1 = −2.5%
The selection may remain equally likely to win under your estimate, but the value has disappeared because the price changed.
Team news, injuries, betting activity, liquidity and bookmaker adjustments can all contribute to pre-match price movement. The guide on why football odds move before kick-off explains how to interpret those changes without assuming they predict the final result.
Line Shopping and Market Consistency
Price comparison is useful only when the markets are identical.
Confirm the same:
- fixture;
- competition;
- outcome;
- betting line;
- settlement period;
- extra-time rules;
- void conditions;
- player-participation requirements.
Do not compare:
- 90-minute home win with team to qualify;
- Over 2.5 with Over 3.5;
- draw no bet with double chance;
- first-half match result with full-time result;
- anytime goalscorer with first goalscorer.
A higher price in a different market does not represent a better version of the original selection.
How to Estimate Football Probabilities?
There is no single method that guarantees accurate probabilities.
A practical football assessment may combine several evidence groups.
Team Strength
Evaluate longer-term attacking and defensive quality rather than only the last result.
Consider:
- goals and expected goals;
- shots and shot quality;
- opponent-adjusted performance;
- home and away strength;
- league level;
- squad quality.
Expected Line-Ups
Estimate which players are likely to start and how replacement quality affects the team.
A missing player’s influence depends on:
- position;
- tactical role;
- substitute quality;
- opponent match-up;
- expected minutes.
Match Context
Review:
- league position;
- competition priority;
- need for a result;
- first-leg score;
- rotation incentives;
- fixture congestion;
- travel;
- rest.
Fixture congestion should be evaluated through player-level minutes and replacement quality. A team playing three matches in eight days is not automatically weakened if it has rotated effectively.
Tactical Match-Up
Assess whether one side’s style creates particular advantages.
Examples include:
- high press against weak build-up;
- aerial strength against poor set-piece defence;
- fast transitions against a high defensive line;
- deep defence against a possession-dominant side.
Uncertainty
A probability estimate should include uncertainty around:
- team news;
- player fitness;
- tactical selection;
- data quality;
- model assumptions;
- small samples.
Instead of relying on one precise figure, use a range.
For example:
- conservative home-win estimate: 46%;
- central estimate: 49%;
- optimistic estimate: 52%.
A price may offer value under one scenario and no value under another.
Margin of Safety in Value Betting
Suppose the offered odds are 2.05.
The raw break-even probability is:
48.78%
Your central estimate is 49%.
The apparent edge is only 0.22 percentage points.
If your realistic probability range is 45% to 53%, the conclusion is highly uncertain.
A small pricing difference may disappear because of:
- model error;
- team-news changes;
- commission;
- taxes or deductions;
- rounding;
- an inferior accepted price.
A margin of safety means requiring enough difference between the offered price and estimated fair odds to account for uncertainty.
There is no universal edge threshold that guarantees a good decision. The appropriate buffer depends on model quality, market liquidity, information reliability and transaction costs.
Value Betting and Closing Odds
The closing price is the final pre-match price available shortly before kick-off.
Comparing the price taken with the closing odds can help evaluate price quality.
For example:
- odds taken: 2.30;
- closing odds: 2.05.
Your earlier price was higher.
If this pattern occurs consistently across a meaningful sample, it may indicate that your process identifies favourable prices before the wider market fully adjusts.
However:
- one closing-price win proves little;
- closing markets are not perfectly accurate;
- prices can move for reasons unrelated to your analysis;
- the final result does not determine whether the earlier price was good.
Track closing-price performance alongside expected value, calibration and actual returns.
Value Betting and Calibration
Calibration measures whether events predicted with a particular probability occur at approximately that frequency over a sufficiently large sample.
Suppose you assign 60% probability to 100 similar selections.
A well-calibrated forecasting process would expect approximately 60 of those outcomes to occur, not necessarily exactly 60.
If only 40 win, the estimates may be systematically overconfident.
If 80 win, the estimates may be too conservative or the sample may contain favourable variance.
Useful probability bands include:
- 50%–54%;
- 55%–59%;
- 60%–64%;
- 65%–69%.
For each band, compare:
- average predicted probability;
- actual success rate;
- average odds taken;
- closing odds;
- return on investment.
Calibration evaluates the probabilities themselves, while profit also depends on the prices accepted.
Expected Value vs Return on Investment
Expected value is a pre-match estimate.
Return on investment is calculated from realised results.
For a betting record:
ROI = net profit ÷ total amount staked × 100
Suppose:
- total staked: ₦100,000;
- total returns: ₦108,000;
- net profit: ₦8,000.
Then:
₦8,000 ÷ ₦100,000 × 100 = 8% ROI
A model can have positive estimated expected value and negative short-term ROI because results vary.
It can also temporarily produce positive ROI through favourable outcomes despite poor probability estimates.
Our guide to prediction accuracy, strike rate and ROI explains why these measurements answer different questions.
Value Betting and Stake Size
Finding a potentially favourable price does not determine how much to stake.
Stake size should consider:
- bankroll;
- estimated edge;
- uncertainty;
- price volatility;
- market limits;
- correlation with other selections;
- personal risk limits.
The NaijaScore9 Kelly Criterion Calculator converts decimal odds, an independent probability estimate and bankroll into a theoretical full or fractional-Kelly allocation.
However, the formula depends entirely on the accuracy of the probability entered.
An overestimated probability can create an excessively large calculated stake. Fractional Kelly reduces exposure but does not correct a poor forecast.
Value Betting and Accumulators
An accumulator combines multiple selections into one price.
Suppose three independent selections each have:
- estimated win probability: 60%;
- available odds: 1.80.
The combined estimated probability is:
0.60 × 0.60 × 0.60 = 21.6%
The combined decimal odds are:
1.80 × 1.80 × 1.80 = 5.832
The combined break-even probability is:
1 ÷ 5.832 = 17.15%
Under those simplified assumptions, the combined price appears favourable.
However, real accumulators introduce additional concerns:
- selections may be correlated;
- probabilities may be inaccurately estimated;
- bookmaker margins are embedded in each price;
- one losing selection defeats the complete accumulator;
- rules may differ across legs;
- high variance can produce long losing runs.
An accumulator is not valuable merely because its displayed return is large.
Each leg should first be assessed independently, and any dependency between outcomes must be considered.
Value Betting and Correct-Score Markets
Correct-score markets contain many possible results.
Suppose 2–1 is offered at 9.00.
The raw break-even probability is:
11.11%
Your model must estimate whether that exact score occurs more frequently than 11.11% after accounting for the complete market margin.
The statement “2–1 looks likely” is insufficient.
A football match could also finish:
- 1–0;
- 1–1;
- 2–0;
- 2–2;
- 3–1;
- 0–1;
- another score.
Each exact score occupies only a limited part of the total probability distribution.
Correct-score prices are often high because the probability assigned to one precise result is relatively low.
Value Betting and Player Markets
Player-market value depends on both player ability and participation assumptions.
Before assessing an anytime-goalscorer price, consider:
- probability of starting;
- expected minutes;
- penalty responsibility;
- set-piece role;
- position;
- substitution pattern;
- team goal expectation;
- opponent defence;
- probability of a goalless match.
A player may be a strong scorer but still offer poor value when:
- the price is too short;
- the player may start on the bench;
- expected minutes are limited;
- another player takes penalties;
- the team has a low expected goal total.
Wait for confirmed line-ups when participation uncertainty materially affects the estimate.
Can Every Outcome Be Negative Value?
Yes.
A bookmaker margin can make every offered outcome unattractive relative to a fair probability distribution.
Suppose your estimates are:
| Outcome | Estimated probability | Fair odds |
| Home | 50% | 2.00 |
| Draw | 28% | 3.57 |
| Away | 22% | 4.55 |
The offered prices are:
| Outcome | Offered odds |
| Home | 1.85 |
| Draw | 3.30 |
| Away | 4.20 |
Every offered price is below your estimated fair odds.
The appropriate conclusion is not to force a selection. It is:
No available outcome provides sufficient value under this estimate.
Choosing not to place a bet is a valid result of analysis.
Can Multiple Outcomes Offer Value?
Under one coherent probability model and one conventional complete market, it is unusual for multiple mutually exclusive outcomes to show substantial positive value simultaneously.
Suppose you estimate:
- home: 48%;
- draw: 30%;
- away: 22%.
These probabilities total 100%.
If both the home and draw appear to offer very large positive value, check whether:
- the prices came from different times;
- the markets or rules differ;
- your probabilities total more than 100%;
- an input was entered incorrectly;
- the bookmaker has published unusual prices;
- different operators are being combined.
Best prices collected across several bookmakers can sometimes create an underround or arbitrage relationship. In that case, use the NaijaScore9 arbitrage calculator to test whether every possible outcome is covered below a combined 100%.
Common Value-Betting Mistakes
Treating a Likely Winner as a Value Bet
A team can have a 75% chance of winning and still be poorly priced.
The required comparison is between 75% and the price available.
Treating High Odds as Value
A large payout is not evidence that the bookmaker has underpriced the outcome.
Ignoring the Complete Market
One raw implied probability includes the effect of the bookmaker’s pricing structure. Examine every possible outcome where practical.
Using Bookmaker Probability as Your Independent Estimate
Copying the implied probability from the same odds provides no separate assessment of value.
Confusing No-Vig Probability With True Probability
Removing the margin produces a cleaner market estimate, not an objective prediction.
Overestimating Recent Form
Five recent results can be influenced by:
- weak opposition;
- finishing variance;
- red cards;
- penalties;
- home or away imbalance;
- rotated line-ups.
Double-Counting Evidence
Do not separately reward a team for:
- goals scored;
- attacking form;
- shots;
- expected goals;
without considering how strongly those measurements overlap.
Ignoring Team-News Uncertainty
An apparent edge can disappear when a key player is absent or a manager rotates unexpectedly.
Comparing Different Markets
A higher price is useful only when the event and settlement conditions match exactly.
Ignoring Costs
Commission, taxes, deductions, currency charges and stake rounding can reduce a small theoretical advantage.
Judging the Method From One Result
One win or loss cannot evaluate the accuracy of a probability model.
Changing the Estimate to Justify the Selection
Probability should determine whether the available price is acceptable—not the other way around.
Chasing Losses
A previous loss does not improve the value of the next selection.
Each price must be assessed independently.
Final Assessment
A value bet is not simply:
- a likely winner;
- a favourite;
- an underdog;
- a high price;
- a popular selection;
- a shortening price.
It is a relationship between:
- the odds available;
- the probability required to break even;
- the complete market margin;
- your independent probability estimate;
- the uncertainty surrounding that estimate.
The process is:
- identify the exact market;
- convert the price into implied probability;
- calculate the complete market overround;
- remove the margin where appropriate;
- build an independent probability estimate;
- convert that estimate into fair odds;
- compare fair odds with the available price;
- calculate estimated expected value;
- account for uncertainty and costs;
- decide whether the difference is meaningful.
The central principle is:
A selection becomes potentially valuable when the available price is greater than the fair price supported by a credible probability estimate—not merely when the outcome looks likely to win.
