
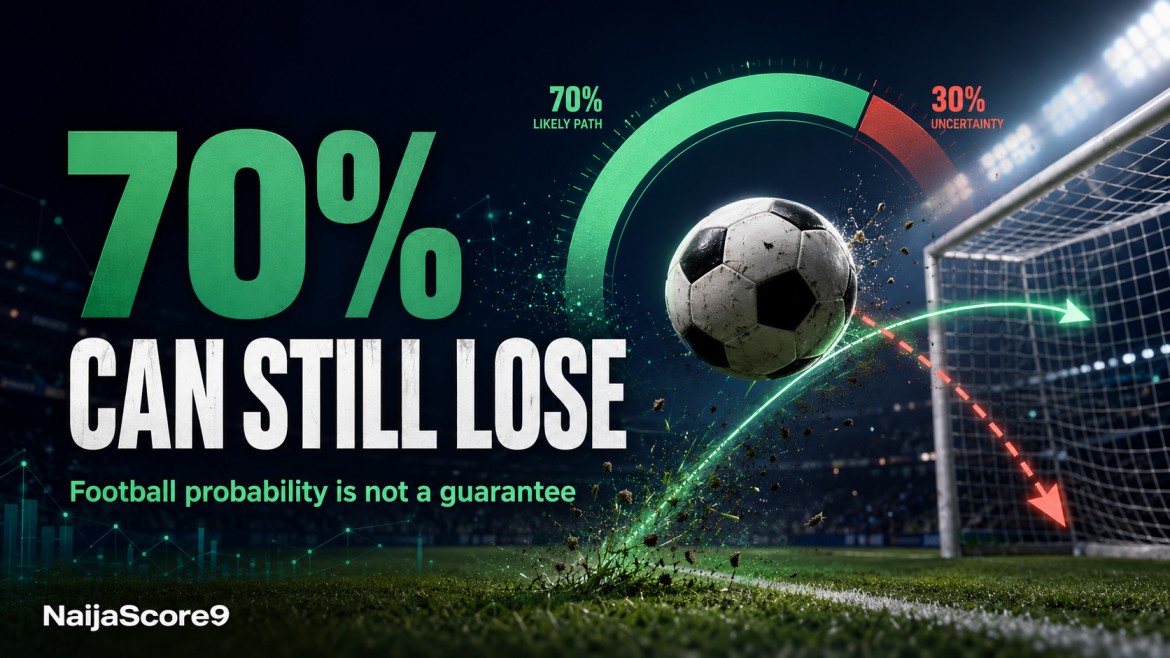
A 70% football prediction is a strong probability, but it is not a promise that the selected team will win.
It means that the model estimates a 70% chance of the predicted outcome happening and a 30% chance of something else happening. That remaining 30% is large enough to produce draws, defeats and other results that may surprise anyone treating the prediction as certain.
Football predictions should therefore be read as estimates of uncertainty—not as guaranteed outcomes.
What Does a 70% Football Prediction Mean?
Suppose a prediction model gives a team:
- 70% probability of winning
- 20% probability of drawing
- 10% probability of losing
The team is the most likely winner, but the draw and away-win probabilities have not disappeared. Together, those alternatives represent a 30% chance that the predicted win will fail.
In plain terms, if the same type of well-calibrated 70% prediction could be repeated under similar conditions 100 times, we would expect roughly 70 wins and 30 non-winning results.
That does not mean the first seven predictions must win and the next three must lose. Results can arrive in any order. Several losses may come close together, followed by a longer winning run.
This relationship between a stated probability and long-term outcomes is known as calibration. A genuinely calibrated model should be correct approximately 70% of the time across a large set of predictions that it rates near 70%—not in every individual match. This is consistent with the standard definition of forecast calibration discussed in probability-forecasting research.
A 70% Chance Still Includes a Real Chance of Losing
People often notice the 70% and mentally ignore the remaining 30%. That is where the misunderstanding begins.
Consider a bag containing seven green balls and three red balls. Drawing a green ball is more likely, but selecting a red one would not be impossible or evidence that the bag was described incorrectly.
A football prediction works in a similar way. The model identifies the outcome with the greatest estimated chance, but the match still has to be played.
For one 70% selection:
| Possible result | Probability |
| Prediction succeeds | 70% |
| Prediction fails | 30% |
A 30% failure probability is almost one chance in three. That is not a rare or impossible event.
Why Can a High-Probability Football Prediction Lose?
1. Football contains unavoidable randomness
Football is a relatively low-scoring sport. One deflection, penalty, goalkeeping mistake or moment of individual brilliance can have a major effect on the final result.
A dominant team may create more chances and control possession but still concede from its opponent’s only shot on target. Another team may score early and defend for the remaining 80 minutes.
Research comparing uncertainty across sports found that football allows underdogs meaningful opportunities to win, partly because individual scoring events have such a strong effect on the result. The study describes football as one of the sports in which weaker teams retain a comparatively realistic chance of an upset.
Randomness does not make football analysis useless. It explains why good analysis improves estimates without eliminating uncertainty.
2. Red cards can transform a match
A model may calculate its probabilities using the expected starting line-ups and normal 11-versus-11 conditions. An early red card can completely change that match.
The affected team may lose possession, attacking threat and defensive structure. The opposing team can then create chances that were unlikely when the original prediction was published.
Unless the model is continuously updated during the game, its pre-match 70% probability cannot account for an unexpected dismissal after kick-off.
3. The stronger team may finish poorly
Creating chances and converting them are different things.
A favourite can produce 15 attempts without scoring, while the underdog converts one counterattack. This is one reason analysts use expected-goals information alongside the final score: the result alone may not describe how the teams performed.
However, even expected goals cannot tell us where the next shot will go. It evaluates chance quality; it does not make finishing predictable.
4. Late team news can reduce prediction quality
Injuries, illness, squad rotation and tactical changes may become public after an early prediction has been generated.
A 70% estimate based on a first-choice striker, goalkeeper and midfield may no longer be appropriate if two important players are missing from the confirmed line-up.
Before using any of today’s football predictions, check when the forecast was last updated and compare it with the latest starting line-ups and team news.
5. The model itself can be wrong
A prediction percentage is an estimate produced from data and assumptions. It is not an objective property printed on the match.
A model can overvalue:
- A long winning run against weak opposition
- Historical head-to-head results
- Home advantage
- League-table position
- Possession without meaningful chances
- Outdated player or injury information
- Results from a small sample
If a team’s real chance was closer to 55%, a model that displayed 70% was overconfident. That is a modelling error, not simply bad luck.
This is why readers should examine the process behind a forecast. The NaijaScore9 prediction methodology explains the signals used to assess matches rather than presenting percentages without context.
6. Motivation and match conditions can be difficult to measure
Football data may not completely capture how urgently each team needs the result.
A club that has already won its group could rotate key players. A relegation candidate may play with unusual intensity. Fixture congestion, long-distance travel, pitch quality and severe weather can also affect performance.
Research involving more than 61,000 professional fixtures found associations between outcomes and factors including team strength, recent performance and match location. These variables are useful, but their importance can differ from one fixture to another. That makes context essential when interpreting a football forecast.
Does 70% Confidence Mean 70% Accuracy?
Not automatically.
A website can display 70% beside a prediction without proving that its past 70% forecasts succeeded at approximately that rate. The displayed confidence and the model’s measured accuracy are different things.
To evaluate a prediction model properly, group a large number of forecasts into probability ranges:
| Prediction range | Expected long-term success rate |
| Around 50% | Approximately 50% |
| Around 60% | Approximately 60% |
| Around 70% | Approximately 70% |
| Around 80% | Approximately 80% |
If predictions labelled 70% succeed only 52% of the time across a meaningful sample, the model is overconfident. If they succeed close to 70%, the forecasts are better calibrated.
A model should also be assessed using all the probabilities it provides, not only whether its top selection won. The Brier score is one recognised method for evaluating the accuracy of probability forecasts because it penalises the difference between predicted probabilities and actual outcomes. It is widely used as a proper scoring rule for probabilistic forecasts. Roulston’s explanation of the Brier score provides the underlying statistical context.
Why Short Losing Streaks Do Not Automatically Prove a Model Is Bad
Even well-calibrated predictions can lose several times.
Assume, only for illustration, that every selection has a genuine 70% chance and the results are independent:
| Scenario | Probability |
| One prediction loses | 30% |
| Two consecutive predictions lose | 9% |
| Three consecutive predictions lose | 2.7% |
| At least one of five predictions loses | 83.2% |
| All five predictions win | 16.8% |
The surprising number is the fourth one. If five independent predictions each have a 70% chance, there is an approximately 83.2% chance that at least one will fail.
This does not mean the forecasts are poor. It means perfection across several matches is much less likely than many users assume.
Similarly, “70% accuracy” does not guarantee exactly seven wins from the next ten predictions. Under the same assumptions, the probability of getting exactly seven wins is only about 26.7%. The final total could be five, six, eight, nine or even ten.
A prediction service should therefore be assessed across a substantial record, not judged from one weekend’s results.
How to Tell Whether a 70% Prediction Is Trustworthy
Check whether the percentages add up
For a standard match-result forecast, the home-win, draw and away-win probabilities should total approximately 100%.
Small differences caused by rounding are normal. Large inconsistencies require an explanation.
Look for supporting match information
A useful probability should be accompanied by relevant evidence, such as:
- Recent team performance
- Home and away records
- Expected goals
- Goals scored and conceded
- Confirmed absences
- Rest and fixture congestion
- Likely tactical match-up
- Market movement
- Time of the latest update
The percentage summarises the analysis; it should not replace it.
NaijaScore9’s football predictions can be used to examine the predicted outcome alongside match information and probability signals.
Evaluate a large sample
Ten predictions are not enough to establish that a model is reliably calibrated. Even 100 predictions may need to be separated by league, market and probability range before the results become informative.
When reviewing a model, ask:
- How many published predictions were tested?
- Were losing predictions included?
- Were forecasts recorded before kick-off?
- Were the original percentages preserved?
- Is performance separated by market and confidence range?
- Does the record cover different leagues and seasons?
Selective screenshots of winning bets do not answer these questions.
Check when the prediction was updated
A percentage produced three days before kick-off may be less useful after important team news appears.
The page should display a publishing or updating time where possible. Readers should then check whether the available information has changed.
Compare the prediction with the betting market
Bookmaker prices provide another estimate of an outcome’s probability, although the bookmaker’s margin is included.
Decimal odds can be converted into a basic implied probability:
Implied probability = 1 ÷ decimal odds
For example:
- Odds of 1.43 imply approximately 69.9%
- Odds of 1.30 imply approximately 76.9%
- Odds of 1.55 imply approximately 64.5%
A 70% model probability corresponds to fair decimal odds of approximately 1.43 before accounting for bookmaker margin.
That distinction matters. A likely outcome is not automatically attractively priced. If your model estimates 70% but the available odds are 1.30, the price requires the outcome to succeed more frequently than the model expects.
Readers can compare football odds and use NaijaScore9’s prediction and odds tools to understand the relationship between percentages and prices.
A High Probability Is Not the Same as a Good Bet
Prediction probability answers:
How likely is this outcome to happen?
Betting value answers:
Is the available price high enough for that probability?
These are related but different questions.
Suppose a team has a genuine 70% chance of winning:
| Available odds | Basic implied probability | Assessment against 70% estimate |
| 1.30 | 76.9% | Price may be too short |
| 1.43 | 69.9% | Approximately fair before margin |
| 1.55 | 64.5% | Potential value if the 70% estimate is reliable |
The most likely outcome in a match can still be poor value when the odds are too low. Conversely, a lower-probability outcome may offer value if its price is sufficiently high.
Bookmaker odds also contain a margin, so converting one price into an implied probability does not remove the bookmaker’s advantage. Research on fixed-odds markets explains how the probabilities derived from all available outcomes commonly total more than 100%, with the difference representing the market margin. Cortis provides a practical explanation of this relationship.
Be Careful When Combining Several 70% Predictions
A common mistake is placing several high-confidence selections in one accumulator and assuming the entire bet remains highly likely to win.
If three independent selections each have a 70% probability, the estimated probability of all three succeeding is:
0.70 × 0.70 × 0.70 = 0.343
That is only 34.3%.
For five independent 70% selections:
0.70⁵ = 16.8%
Each individual prediction may be more likely to win than lose, while the combined accumulator remains more likely to lose than win.
The calculation may become even less reliable when selections are connected—for example, combining a team to win, the same team to score over 1.5 goals and one of its players to score. These outcomes are not independent.
A Practical Checklist Before Using a Football Prediction
Before relying on a displayed percentage, check the following:
- Is the market clearly identified?
- Do all outcome probabilities total approximately 100%?
- Is the prediction still current?
- Have the confirmed line-ups been released?
- Are important injuries or suspensions included?
- Is there enough historical data behind the estimate?
- Does recent performance have proper context?
- How does the probability compare with current odds?
- Is the model calibrated across a large sample?
- Are you treating the percentage as an estimate rather than a guarantee?
No percentage removes the possibility of an unexpected result. If you choose to bet, set a fixed limit and avoid increasing stakes to recover a previous loss. See the NaijaScore9 responsible betting guide for practical safeguards.
The Key Point
A 70% football prediction can lose because 70% is not 100%.
The prediction says the selected outcome is more likely than the alternatives. It does not say an upset, draw, red card, missed penalty or poor finishing performance cannot happen.
The correct way to assess a prediction is to ask whether its percentage was reasonable based on the information available before the match, and whether similar forecasts are well calibrated over time.
One losing match cannot prove that a model is inaccurate, just as one winning match cannot prove that it is reliable. Prediction quality becomes clearer only through transparent methodology, properly recorded results and a sufficiently large sample.