
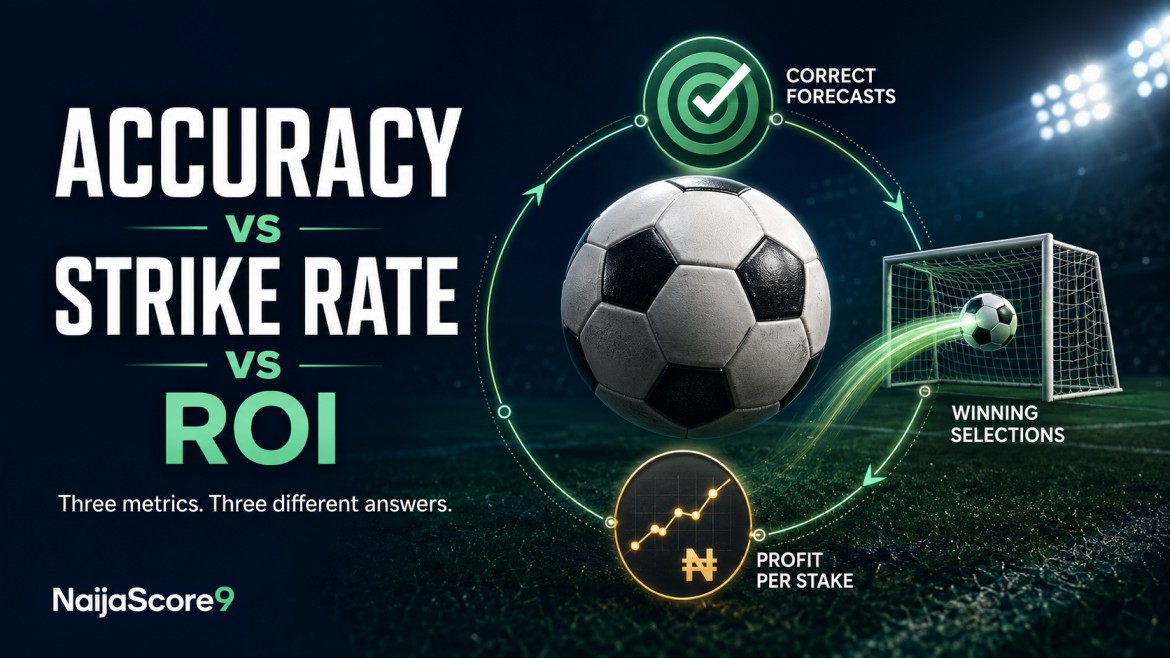
Prediction accuracy, strike rate and return on investment, usually shortened to ROI, measure three different things.
- Prediction accuracy measures how often forecasts are correct.
- Strike rate measures how often settled betting selections win.
- ROI measures how much profit or loss is generated relative to the total amount staked.
These percentages can sometimes look similar, but they are not interchangeable.
A prediction service can have a high accuracy rate and still produce a negative ROI. Another service can have a lower strike rate but achieve a positive ROI by winning at higher average odds.
To assess football prediction performance properly, you need to understand all three measurements and the information each one leaves out.
Prediction Accuracy vs Strike Rate vs ROI: Quick Comparison
| Metric | What it measures | Basic formula | Main limitation |
| Prediction accuracy | Percentage of forecasts that were correct | Correct predictions ÷ total predictions | Ignores odds and profitability |
| Strike rate | Percentage of settled selections that won | Winning bets ÷ winning and losing bets | Ignores prices and value |
| ROI | Profit or loss relative to money staked | Net profit ÷ total stakes | Can be unstable over small samples |
The most important distinction is simple:
“Accuracy measures forecasting correctness, strike rate measures winning frequency, and ROI measures financial efficiency.”
What Is Prediction Accuracy?
Prediction accuracy is the percentage of published forecasts that match the outcome.
Prediction accuracy formula
Prediction accuracy = Correct predictions ÷ Total settled predictions × 100
Suppose a model publishes 100 football predictions and 64 are correct:
64 ÷ 100 × 100 = 64% prediction accuracy
This tells us that the model selected the correct outcome in 64 of the 100 evaluated matches.
It does not tell us:
- What odds were available
- Whether every prediction became a bet
- How much was staked
- Whether the correct selections were short-priced favourites
- Whether the incorrect predictions caused a financial loss
- Whether the model’s probabilities were reliable
Prediction accuracy is therefore useful, but incomplete.
What Counts as a Correct Football Prediction?
That depends on the market being evaluated.
Match-result predictions
For a standard home-draw-away prediction, the forecast is correct only if the selected match result occurs.
If the model predicts a home win and the match finishes as a draw, the prediction is incorrect—even if the home team dominated possession and expected goals.
Over/under predictions
An over 2.5 goals prediction is correct when the match produces at least three goals.
An under 2.5 prediction is correct when the match produces no more than two goals.
Both teams to score
A “BTTS Yes” prediction succeeds when both teams score. “BTTS No” succeeds when at least one side fails to score.
Double chance
A double-chance selection covers two outcomes. For example, “home or draw” succeeds when the home team wins, or the match ends level.
Because different markets have different baseline probabilities, their accuracy rates should not be compared without context.
An 80% double-chance accuracy rate is not automatically more impressive than a 55% match-result accuracy rate.
Why Prediction Accuracy Can Be Misleading?
It treats every correct forecast equally
Suppose one model assigns a home team a 51% winning probability while another assigns it 90%. If the team wins, simple prediction accuracy gives both models one correct result.
The metric ignores the large difference in confidence.
Probabilistic forecasts are better assessed with calibration and proper scoring rules, such as the Brier score. Research on forecast evaluation explains that simple classification accuracy focuses on the selected outcome while disregarding much of the uncertainty contained in the full probability distribution. The Journal of Machine Learning Research provides a detailed comparison.
It can reward obvious favourites
A model can increase its prediction accuracy by selecting strong favourites repeatedly.
However, short odds require a very high win rate to break even. Correctly predicting many favourites does not automatically create value.
It does not account for draws correctly across different methods
A football model that always predicts either the home or away team may achieve a respectable hit rate while failing to handle draw probability accurately.
That weakness can matter when the model is used for match-result decisions.
It can hide selective reporting
A prediction provider might calculate accuracy from only its strongest selections while ignoring every lower-confidence forecast.
A trustworthy accuracy record should explain:
- Which predictions are included
- Which markets are evaluated
- How void outcomes are treated
- When forecasts were recorded
- Whether losses remain visible
- What sample period is used
What Is Strike Rate?
Strike rate is the percentage of settled betting selections that win.
It is also called:
- Win rate
- Hit rate
- Success rate
- Winning percentage
Strike-rate formula
For straightforward win-or-lose markets:
Strike rate = Winning bets ÷ (Winning bets + Losing bets) × 100
Suppose 50 settled selections produce:
- 29 wins
- 21 losses
- 2 additional void bets
The void bets are normally excluded from the win-and-loss calculation:
29 ÷ (29 + 21) × 100 = 58% strike rate
The record should still disclose the two void bets rather than silently removing them.
Is Strike Rate the Same as Prediction Accuracy?
Sometimes—but not always.
The two metrics will be numerically identical when:
- Every prediction becomes a bet
- Every market has a simple win-or-lose settlement
- The same evaluation period is used
- No selection is filtered by price
- Voids are treated consistently
They differ when a model publishes 100 predictions but only 30 meet the criteria for an actual selection.
For example:
- 100 published predictions
- 62 correct predictions
- Prediction accuracy: 62%
- 30 qualifying betting selections
- 17 winning selections
- Strike rate: 56.7%
The model’s accuracy is calculated from all 100 forecasts. Its strike rate is calculated from the 30 selections that were actually tracked as bets.
A website should never switch between these terms without explaining the sample behind each percentage.
How Should Void and Partial Settlements Be Treated?
Simple strike-rate calculations work best for markets that settle as either a full win or a full loss.
Some markets produce more complicated results:
- Void
- Push
- Half win
- Half loss
- Partial cash-out
- Dead heat
- Cancelled match
A void or push normally returns the stake and should be reported separately rather than counted as a win.
For Asian handicap or split-line markets, half wins and half losses require a declared method. They can be measured through unit profit rather than forced into a simple win-rate calculation.
The key is consistency. The settlement policy should be published before results are calculated.
What Is ROI in Betting?
ROI means return on investment. In this article, betting ROI refers to net profit or loss divided by the total amount staked.
Some platforms call the same calculation “yield” and reserve ROI for bankroll growth. Because terminology varies, every results page should publish the exact formula it uses.
Betting ROI formula
ROI = Net profit ÷ Total amount staked × 100
Where:
Net profit = Total returns − Total stakes
Suppose a user places 20 bets of ₦1,000 each:
- Total stakes: ₦20,000
- Total returns: ₦22,400
- Net profit: ₦2,400
The ROI is:
₦2,400 ÷ ₦20,000 × 100 = 12% ROI
A 12% ROI means the selections generated a net profit of ₦12 for every ₦100 staked during that sample.
If the returns were only ₦18,000:
- Net loss: ₦2,000
- ROI: −10%
A negative ROI indicates that the amount returned was lower than the amount staked.
ROI Is Not the Same as Total Return
This distinction prevents a common calculation mistake.
If you stake ₦1,000 at decimal odds of 2.00 and win:
- Total return: ₦2,000
- Original stake returned: ₦1,000
- Net profit: ₦1,000
The profit is not ₦2,000 because the total return includes the original stake.
ROI must use net profit or loss—not the gross amount returned.
Why a High Strike Rate Can Still Produce a Negative ROI?
Strike rate does not account for the odds attached to each winning selection.
Consider ten ₦1,000 bets:
Strategy A: High strike rate, negative ROI
- Bets: 10
- Wins: 6
- Losses: 4
- Average winning odds: 1.60
- Total staked: ₦10,000
- Total returned: 6 × ₦1,600 = ₦9,600
- Net result: −₦400
- Strike rate: 60%
- ROI: −4%
Six of the ten selections won, but the strategy still lost money.
Strategy B: Lower strike rate, positive ROI
- Bets: 10
- Wins: 4
- Losses: 6
- Average winning odds: 3.00
- Total staked: ₦10,000
- Total returned: 4 × ₦3,000 = ₦12,000
- Net result: +₦2,000
- Strike rate: 40%
- ROI: +20%
Strategy B won less frequently but produced the better financial result.
| Strategy | Strike rate | Average winning odds | Net result | ROI |
| A | 60% | 1.60 | −₦400 | −4% |
| B | 40% | 3.00 | +₦2,000 | +20% |
This is why a strike-rate claim without average odds is difficult to evaluate.
What Is the Break-Even Strike Rate?
The break-even strike rate is the percentage of bets that must win at given decimal odds before bookmaker margin and other practical factors.
Formula
Break-even strike rate = 1 ÷ Decimal odds × 100
| Decimal odds | Approximate break-even strike rate |
| 1.20 | 83.3% |
| 1.40 | 71.4% |
| 1.50 | 66.7% |
| 1.80 | 55.6% |
| 2.00 | 50.0% |
| 2.50 | 40.0% |
| 3.00 | 33.3% |
A 60% strike rate sounds strong. At average odds of 2.00, it could be profitable. At average odds of 1.50, it would be below the approximate 66.7% break-even requirement.
NaijaScore9’s betting calculators and odds tools can help users convert decimal odds into implied probabilities.
Can High Prediction Accuracy Still Lose Money?
Yes.
Assume a prediction provider makes 100 selections at average decimal odds of 1.20 and wins 70 of them.
With one unit staked on every selection:
- Total staked: 100 units
- Total returned: 70 × 1.20 = 84 units
- Net result: −16 units
- Prediction accuracy: 70%
- Strike rate: 70%
- ROI: −16%
The record looks impressive when only the 70% success rate is displayed. The financial result tells a different story.
At odds of 1.20, the approximate break-even strike rate is 83.3%. Winning 70% is not enough.
This is closely related to why a 70% football prediction can still lose: probability, certainty and financial value are separate ideas.
Can a Low Accuracy Rate Still Produce a Positive ROI?
Yes, particularly when the successful selections have higher prices.
Suppose a strategy wins only 30 of 100 bets, but the average winning odds are 4.00:
- Total staked: 100 units
- Total returned: 30 × 4.00 = 120 units
- Net profit: 20 units
- Strike rate: 30%
- ROI: 20%
A 30% strike rate may appear weak, but the break-even strike rate at odds of 4.00 is 25%.
This does not mean that high odds are automatically better. Higher-priced outcomes normally win less often and can produce longer losing runs. It only demonstrates why win frequency must be examined together with price.
Which Metric Is Most Important?
There is no single best metric for every purpose.
When evaluating a prediction model
Look at:
- Prediction accuracy
- Probability calibration
- Brier score or log loss
- Performance by market
- Performance by confidence range
- Sample size
- Comparison with a simple baseline
Accuracy alone cannot show whether the probability estimates were sensible.
A 2024 peer-reviewed sports-betting study found that selecting models based on probability calibration produced better returns than selecting models based only on accuracy within the authors’ NBA experiment. That does not establish a universal return level, but it illustrates why calibrated probabilities can be more useful than raw winner counts.
When evaluating a tipster or selection service?
Look at:
- Strike rate
- Average odds
- Number of selections
- Units won or lost
- ROI
- Largest drawdown
- Market and league breakdown
- Time-stamped prices
Strike rate becomes meaningful only when paired with the average odds.
When evaluating financial efficiency?
ROI is the most direct of the three metrics, but it must be supported by:
- A sufficiently large sample
- Realistic available odds
- Transparent stakes
- Consistent settlement rules
- Complete records
- No deleted losses
A positive ROI over 15 bets could result from short-term variance. A longer transparent record provides stronger evidence.
Why Sample Size Changes the Meaning of Every Metric?
A 75% strike rate from four selections means three wins and one loss. It does not provide strong evidence of long-term performance.
The same 75% strike rate across 1,000 comparable selections is far more informative.
Small samples can be influenced by:
- One high-odds winner
- A short winning streak
- One unusually large stake
- A void selection
- A postponed fixture
- Several closely related bets
- Selective publication
When comparing prediction performance, always show the number of observations beside the percentage.
“68% accuracy” is incomplete.
“68% accuracy across 500 time-stamped match-result predictions” provides much more information.
Accuracy Must Be Compared With a Baseline
A percentage is meaningful only when compared with the difficulty of the task.
Suppose home teams win 48% of matches in a particular dataset. A model that predicts the home team in every match could achieve approximately 48% accuracy without conducting meaningful analysis.
The model’s accuracy should therefore be compared with:
- Always selecting the most common outcome
- Bookmaker-implied favourites
- League average probabilities
- A simple home-advantage model
- Previous versions of the prediction model
Academic research comparing football forecast methods has also separated forecasting accuracy from potential betting profit. A study of German top-flight matches found that prediction markets and bookmaker odds performed similarly as forecasters, while profitability depended on prices and transaction costs. That distinction is central to understanding why correct forecasting and financial return are not identical.
Prediction Accuracy Should Include Probability Quality
NaijaScore9 football pages may show estimated home-win, draw, and away-win probabilities.
If a model displays:
- Home win: 60%
- Draw: 25%
- Away win: 15%
Simple accuracy evaluates only whether the home team won.
A fuller evaluation asks:
- Did outcomes given around 60% occur roughly 60% of the time?
- Were draw probabilities reliable?
- Was the model consistently overconfident?
- Did 80% predictions perform better than 55% predictions?
- How closely did the forecast probabilities match eventual outcomes?
This is known as calibration.
The NaijaScore9 prediction methodology explains why probability, confidence, available data, and update timing should be considered together.
A Better Football-Prediction Results Table
A transparent results page should include more than wins and losses.
| Field | Why it matters |
| Prediction date and time | Proves the forecast existed before kick-off |
| Match and market | Identifies exactly what was predicted |
| Published probability | Allows calibration analysis |
| Odds recorded | Connects the selection with its available price |
| Stake in units | Makes profit calculations comparable |
| Result | Shows win, loss or void |
| Net profit | Records the actual financial outcome |
| Cumulative ROI | Shows efficiency over the full sample |
| Market category | Reveals where performance is strongest or weakest |
Publishing these fields makes it harder to inflate performance through selective reporting.
How to Compare Two Prediction Services Fairly?
Before deciding that one record is better than another, make sure both use:
- The same definition of a prediction
- Similar football markets
- Similar evaluation periods
- Comparable odds ranges
- The same treatment of voids
- Similar staking assumptions
- Complete, time-stamped results
- A meaningful sample size
A service predicting double chance at average odds of 1.25 should not be compared directly with one predicting correct scores at average odds of 8.00.
Their strike rates will naturally be very different.
Warning Signs in Accuracy, Strike-Rate and ROI Claims
Be cautious when a results page displays:
A percentage without a sample size
“90% strike rate” may represent nine wins from ten selections.
A strike rate without average odds
The winning frequency cannot be compared with the required break-even rate.
ROI without total stakes
A 20% ROI means little if the denominator and staking method are hidden.
Profit without losing periods
Every variable-outcome strategy can experience losing runs. A graph showing only growth without drawdowns may be incomplete.
Deleted or edited predictions
Predictions should be recorded before kick-off and preserved after settlement.
Unrealistic fixed claims
Prediction accuracy and ROI vary by market, competition, odds range and sample period. They should not be presented as guaranteed future performance.
How NaijaScore9 Readers Should Use These Metrics?
When reviewing football predictions, begin with the forecast probability and supporting match context.
After results are available:
- Use prediction accuracy to measure how often the selected outcome was correct.
- Use calibration to assess whether the probabilities were realistic.
- Use strike rate to measure the winning frequency of qualifying selections.
- Compare the strike rate with the average odds.
- Use ROI to measure profit or loss against total stakes.
- Check sample size, drawdown and market-specific performance.
- Compare recorded prices with current football odds.
No metric should be used as a promise of future returns.
The Key Difference
Prediction accuracy, strike rate and ROI answer three separate questions:
- Prediction accuracy: How often was the forecast correct?
- Strike rate: How often did the tracked selections win?
- ROI: How efficiently did those selections convert stakes into profit or loss?
A complete evaluation needs all three, plus average odds, probability calibration and sample size.
High accuracy without sufficient prices can lose money. A high strike rate without transparent odds can be misleading. Positive ROI over a small sample can disappear as more results are added.
The strongest performance record is not the one with the largest headline percentage. It is the one with clear definitions, complete results, realistic prices and enough data to support its claims.
If betting is involved, use fixed limits and never increase stakes simply to recover a previous loss. See NaijaScore9’s responsible betting guide for additional safeguards.