
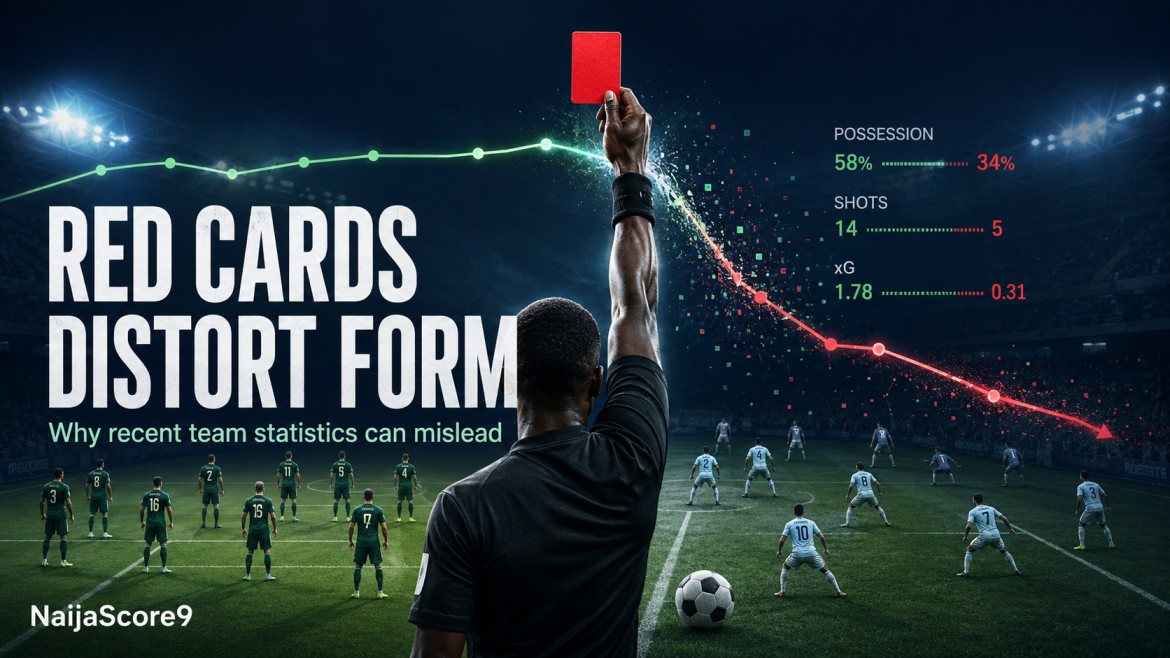
A red card can make a football team’s recent form look much better or worse than its normal performance. When a player is sent off, the match changes from 11v11 to 10v11, often affecting possession, goals, shots, expected goals (xG) and defensive statistics.
Let’s understand more deeply how red cards affect team form, for example, a team that loses 3–0 after receiving a red card in the 18th minute may appear defensively weak in its last-five-match record. But that scoreline does not tell us how the team performed before the dismissal or how it might have played with eleven players.
The distortion affects both sides. The penalised team may record unusually poor numbers, while its opponent benefits from playing against ten men.
To assess recent team form accurately, identify when the red card occurred, compare performance before and after the dismissal, and interpret the final statistics in that context. The result still counts, but it should not be treated as an ordinary 11v11 performance.
Why Does a Red Card Distort Recent Team Form?
A football team normally prepares to play with eleven players. When one player is dismissed, the manager must reorganise the entire system.
The team playing with ten may:
- Remove an attacker for a defender
- Drop into a deeper defensive block
- Stop pressing high up the pitch
- Commit fewer players to attacks
- Allow the opponent more possession
- Concede more shots and corners
- Rely on counterattacks or set pieces
- Prioritise protecting the current score
The opposing team also changes. It can move more players forward, circulate the ball against a deeper defence and create chances with less concern about being overloaded in midfield.
The final score, possession, shots and expected-goals figures are therefore produced under abnormal manpower conditions.
Research covering 1,826 matches from Europe’s five leading domestic leagues found that a sending-off significantly changes the scoring rates of both teams, harming the penalised side and favouring its opponent. The study accounted for team strength, home advantage, goal difference and the timing of the card.
That is why red cards should be treated as major context events in recent team-form statistics.
How Red Cards Affect Key Football Statistics?
| Statistic | Team with 10 | Team with 11 |
| Goals scored | May decrease | May increase |
| Goals conceded | May increase | May decrease |
| Possession | Often decreases | Often increases |
| Shots | May decrease | May increase |
| Expected goals (xG) | May fall | May rise |
| Corners | May decrease | May increase |
| Clearances and blocks | May increase | May decrease |
These are general tendencies, not guaranteed outcomes. The actual effects depend on the dismissal minute, scoreline, tactics and team strength.
Which Football Statistics Can a Red Card Distort?
Match results
The most visible distortion appears in the final score.
A team that was competing evenly at 0–0 may lose 3–0 after playing 70 minutes with ten men. A recent-form table records only the defeat unless additional match context is provided.
The loss remains valid. However, using it as evidence that the team would normally concede three goals under equal conditions can produce a misleading conclusion.
Goals scored and conceded
The penalised team generally has fewer attacking opportunities and faces greater defensive pressure. Its goals-scored average may fall while its goals-conceded average rises.
The opponent receives the opposite statistical benefit.
A World Cup study found that the scoring rate of the dismissed player’s team decreased while the scoring rate of the team with the numerical advantage increased. The size of the effect depended partly on when the red card occurred. The research examined World Cup matches from 1998 to 2014.
Consequently, one early dismissal can materially affect a five-match goals average.
Possession
Possession after a red card does not always reflect the teams’ normal ability to control a match.
The ten-player team may deliberately surrender the ball and defend compactly. Meanwhile, the opponent may accumulate possession by passing around a deep block.
A final possession figure of 68% to 32% might suggest complete dominance. If the numbers were close before a 25th-minute dismissal, that interpretation would be incomplete.
Shots and shots on target
A team with eleven players can use its extra player to sustain attacks and recover possession more quickly. This may increase:
- Total shots
- Shots inside the penalty area
- Shots on target
- Blocked attempts
- Attacking set pieces
The penalised team may produce almost no attacking output after reorganising. Its final shot count can therefore make the attack look weaker than it usually is.
Conversely, the opponent’s high shot total may overstate how effectively it would create chances against eleven players.
Expected goals
Expected goals measures the quality of chances created, but it does not automatically remove the effect of a sending-off.
If a team creates 2.4 xG against ten players, that figure still reflects the numerical advantage. It should not be treated as equivalent to creating 2.4 xG against a full team.
The penalised side’s low xG may also result from tactical survival rather than its usual attacking level.
Analysts should ideally separate chances created before and after the dismissal. A single full-match xG number can hide a major change in match conditions.
Corners and attacking pressure
The team with eleven players may force the opponent deeper, resulting in more crosses, blocked shots and corners.
This can inflate recent corner averages for the advantaged team while suppressing them for the penalised side. The distortion becomes especially important when evaluating corner-related trends or football betting markets.
Passing and defensive statistics
A red card can also change:
- Pass completion
- Progressive passes
- Final-third entries
- Tackles
- Clearances
- Interceptions
- Defensive actions
- Pressing intensity
A team defending with ten players may record unusually high clearances and blocks. Those numbers do not necessarily indicate an excellent defensive performance; they may simply show how much pressure the team faced.
Red Cards Distort the Statistics of Both Teams
Analysts sometimes adjust the penalised team’s performance but forget about its opponent.
That is a mistake.
Suppose Team A beats Team B 4–0 after Team B receives a red card in the 12th minute. The dismissal affects both sides:
- Team B’s defensive record looks considerably worse.
- Team A’s attack looks considerably stronger.
- Team B’s possession and shot figures are suppressed.
- Team A’s possession and shot figures are inflated.
- The match contributes to Team A’s winning streak.
- The result contributes to Team B’s losing streak.
A form model that adjusts only Team B continues to overrate Team A.
Every red-card match should be flagged for the dismissed team and its opponent.
The Timing of the Red Card Matters
A dismissal in the fifth minute can influence almost the entire match. A red card in the 89th minute may have little time to affect the final statistics.
Treating both events equally creates another form-analysis error.
The following framework can be used as an editorial guide:
| Red-card minute | Potential statistical distortion |
| 1–30 | Major: most of the match is played under unequal conditions |
| 31–60 | High: enough time remains to alter tactics and core statistics |
| 61–75 | Moderate: important, but much of the match has already been played |
| 76–90+ | Usually more limited: assess what changed after the card |
This is not a universal mathematical weighting system. The actual effect depends on the score, team strength, card recipient and match situation.
Research on more than 2,000 UEFA Champions League and Europa League matches found that the relationship between a dismissal and the final outcome varied with factors including which team received the card and when it occurred. The findings reinforce why the timing of a sending-off cannot be ignored.
The Score at the Time of the Card Also Matters
The dismissal minute should always be considered together with the score state.
Compare these situations:
- A team receives a red card while leading 2–0.
- A team receives a red card while drawing 0–0.
- A team receives a red card while already losing 2–0.
The tactical response will be different in each case.
A team leading 2–0 may defend deeply and accept reduced possession. A team drawing may initially protect the point before taking risks late in the match. A team already behind may have to attack despite its numerical disadvantage.
This is also important because red cards are not completely random events. Teams that are losing may take greater risks, commit tactical fouls or become frustrated.
If a team was already playing poorly before the dismissal, the entire performance should not be excused because a player was sent off. The analyst must separate what happened before the card from what happened afterwards.
Does the Position of the Dismissed Player Matter?
Yes. Losing different players can produce different tactical consequences.
Goalkeeper
If a goalkeeper is dismissed, an outfield player is normally removed so that a substitute goalkeeper can enter. The team therefore loses both its original goalkeeper and one outfield position.
Central defender
A dismissed centre-back may force an immediate defensive substitution or formation change. The team can lose aerial strength, organisation and control of central areas.
Central midfielder
Losing a midfielder may damage ball progression, pressing and the ability to protect the defence.
Forward or winger
A team may preserve more of its defensive structure after losing an attacker, but its counterattacking threat and ability to retain the ball can decline.
A basic recent-form table rarely captures any of these differences.
A Worked Example of Distorted Recent Form
Imagine a team has produced these five results:
| Match | Result | Important context |
| 1 | Won 2–0 | Normal 11v11 match |
| 2 | Drew 1–1 | Normal 11v11 match |
| 3 | Lost 0–3 | Red card in the 18th minute at 0–0 |
| 4 | Won 2–1 | Normal 11v11 match |
| 5 | Won 1–0 | Normal 11v11 match |
Its raw five-match record is:
- Three wins
- One draw
- One defeat
- Six goals scored
- Five goals conceded
- Average of 1.20 goals scored per match
- Average of 1.00 goal conceded per match
Across the four matches completed without an early dismissal, it conceded only two goals—an average of 0.50 per match.
This does not mean the 0–3 result should be deleted. The match still revealed information:
- A player committed a red-card offence.
- The team had to manage a long numerical disadvantage.
- Its tactical response can be assessed.
- Its discipline may be a recurring concern.
- The dismissed player may be unavailable for the next fixture.
However, describing the team as an average one-goal-per-game defence without mentioning the red card would hide an important part of the evidence.
How to Separate 11v11 and 11v10 Football Statistics?
A football match containing a red card is not one continuous performance under equal conditions. For meaningful analysis, divide the available data into separate periods.
Compare the Match Before and After the Red Card
Consider a hypothetical match in which Team A receives a red card after 30 minutes.
| Metric | First 30 minutes (11v11) | Remaining 60 minutes (10v11) |
| Team A shots | 5 | 3 |
| Team B shots | 4 | 13 |
| Team A xG | 0.55 | 0.25 |
| Team B xG | 0.40 | 1.65 |
| Team A goals | 0 | 0 |
| Team B goals | 0 | 2 |
Team A finishes with eight shots and 0.80 xG, while Team B finishes with 17 shots and 2.05 xG.
A full-match comparison suggests that Team B dominated. However, the opening 30 minutes were more balanced. Much of Team B’s advantage developed after Team A was reduced to ten players.
This does not prove that Team A would have avoided defeat with eleven players. It tells us that the final totals combine two different playing conditions.
Calculate 11v11 Statistics Per 90 Minutes
Where event-level data is available, analysts can estimate a team’s statistical rate during the period before the dismissal.
11v11 shots per 90 = (shots taken during 11v11 play ÷ minutes played at 11v11) × 90
In the example:
(5 ÷ 30) × 90 = 15 shots per 90 minutes.
This is a descriptive rate, not a prediction that Team A would have taken exactly 15 shots without the red card.
Thirty minutes is a small sample, and performance also depends on the opponent, venue, score and phase of play. A more reliable comparison combines multiple matches rather than extrapolating one short period.
Use Two Views of Recent Form
When evaluating a team’s last five or ten fixtures, retain the official results and examine an additional contextual view:
- Raw form: All actual match results and full-match statistics.
- Contextual form: The same sample, with red-card games flagged and equal-strength periods examined separately where data permits.
The contextual view helps identify whether an unusually heavy defeat reflects persistent weakness or a temporary numerical disadvantage.
It should not automatically exclude every dismissal. Repeated disciplinary problems are themselves relevant information about a team’s performance.
Common Mistakes When Reading Form After a Red Card
Using only the final score
The result does not reveal when the card occurred, what the score was at that moment or how the teams performed beforehand.
Removing the match completely
Deleting every red-card match can also distort the data. Discipline is part of team performance, and the match may still contain useful 11v11 evidence.
The better approach is contextual adjustment, not automatic deletion.
Adjusting only the penalised team
The numerical advantage can inflate the winning team’s goals, shots, possession and xG. Both teams require context.
Treating every red card equally
An 8th-minute sending-off and an 88th-minute dismissal do not create the same statistical exposure.
Ignoring the pre-card performance
A team that was already losing 2–0 and being outplayed before the card cannot attribute the entire defeat to the dismissal.
Assuming ten players always perform worse in every statistic
A ten-player team may defend efficiently, score on a counterattack or protect an existing lead. The red card changes the probability and tactical environment; it does not mechanically determine the final result.
How to Adjust Recent Team-Form Analysis?
Step 1: Identify every red-card match
Check whether either team received a red card during the chosen form period. Do not rely only on the final results list.
Step 2: Record the dismissal context
For each card, note:
- Minute of dismissal
- Score at the time
- Home or away team
- Player position
- Straight red or second yellow
- Final result
- Minutes played with ten players
Step 3: Split the match into game states
Where detailed data is available, compare:
- Performance before the red card
- Performance after the red card
- 11v11 shots and xG
- 11v10 shots and xG
- Possession before and after
- Changes in formation or substitutions
This produces a much clearer picture than full-match totals alone.
Step 4: Keep the result but reduce misplaced influence
The match should remain part of the official form record. However, post-dismissal statistics should not carry the same interpretation as normal 11v11 performance.
There is no universal percentage by which every red-card match should be discounted. A sensible adjustment depends on how early the card occurred and what was happening before it.
Step 5: Adjust the opponent’s statistics
If one team’s figures were suppressed, the opponents were probably affected in the opposite direction.
A large victory against ten players should not automatically receive the same analytical weight as a large victory against a full-strength opponent.
Step 6: Compare a longer sample
A five-match window can be heavily influenced by one unusual fixture. Comparing five-match and ten-match form helps reveal whether the apparent trend survives a broader sample.
Step 7: Check the next-match suspension
The effect of a red card may continue beyond the match in which it occurred.
If an important player is suspended, the next prediction should account for:
- The player’s role
- Available replacement
- Possible formation change
- Length of suspension
- Other injuries or absences
NaijaScore9’s football predictions should be interpreted alongside current suspension and team-news information, rather than recent results alone.
How Red-Card Distortion Affects Football Predictions
Recent form is often an input in football prediction models. If card-affected matches are treated as normal matches, several markets can be misread.
Match-result predictions
A team may be underrated after an early dismissal caused a heavy defeat. Its opponent may be overrated after benefiting from the numerical advantage.
Over/under goals
An early red card can produce an unusually high-scoring match. Adding that score to a short goals average may create a false expectation of another high-total fixture.
Both teams to score
The penalised team may stop attacking and finish without scoring. That result can suppress its BTTS rate even if its normal 11v11 attack remains productive.
Correct score
A 4–0 or 5–1 result influenced by a dismissal should not become the primary basis for predicting another extreme scoreline.
Shots and corners
The opponent’s shots and corner totals may be inflated by prolonged pressure against ten players. The dismissed team’s attacking numbers may be artificially low.
Card-related markets
Repeated dismissals may still reveal a discipline problem. Examine the number of fouls, yellow cards, player behaviour and match context rather than assuming every red card was random.
For more market-specific information, see NaijaScore9’s football card betting guide.
How NaijaScore9 Should Use Red-Card Context?
A strong prediction process should not read recent form as a simple sequence of green and red result indicators.
Red-card matches should be flagged as special game states. Useful data points include:
- The score when the dismissal occurred
- Minutes played at 11v11
- Minutes played at 11v10
- Pre-card and post-card xG
- Pre-card and post-card shots
- Strength of the opponent
- Venue
- Player position
- Suspension effect on the next fixture
This approach supports the broader NaijaScore9 prediction methodology, in which probability, confidence, data context and update timing should work together.
The objective is not to excuse every poor result. It is to prevent an abnormal match state from being mistaken for normal team strength.
The Key Takeaway
Red cards can distort recent football team-form statistics because they change the conditions under which teams produce their results.
A team reduced to ten players may concede more chances, surrender possession and create fewer attacking opportunities. At the same time, its opponent may record stronger goals, shots and xG figures because of the numerical advantage.
The most reliable approach is to keep the official result while examining the context behind it: the dismissal minute, the score at that moment, the performance before the card and the time spent playing 11v10.
A red-card match still tells us something about discipline, tactical adaptability and team performance. It simply should not be interpreted in exactly the same way as a match played entirely at equal strength.